Results for: stuart murphy
Below is a list of 4 the books by this author.
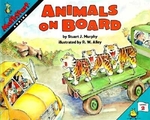
ANIMALS ON BOARD
By: stuart murphy | Published: August 1998
Ride along with trucker Jill and her dog as they add up the animals zooming by. But these are no ordinary animals, and they're bound for a surprise... [Read More]
Ride along with trucker Jill and her dog as they add up the animals zooming by. But these are no ordinary animals, and they're bound for a surprise destination!Ride along with trucker Jill and her dog as they add up the animals passing by on other trucks. But these are no ordinary animals, and theyre bound for a surprise destination! Lively illustrations by R.W. Alley make adding truckloads of fun.
- ISBN
9780064467162 - Binding
Paperback - Category
Picture Book
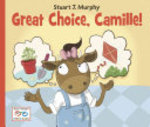
GREAT CHOICE CAMILLE
By: stuart murphy | Published: February 2013
At school Camille learns the importance of making decisions.
Theme: Pre-School, Kindergarten
- ISBN
9781580894760 - Binding
Hardcover - Category
Science - Math
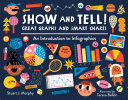
SHOW & TELL GREAT GRAPHS & SMART CHA
By: stuart murphy | Published: October 2022
A visual-learning expert races up the charts and graphs math success with kid-friendly content sure to help with homework. Want to find the most... [Read More]
A visual-learning expert races up the charts and graphs math success with kid-friendly content sure to help with homework. Want to find the most popular meal in the cafeteria? Compare town sports enrollments? Or maybe you just want to know who burps the most in your family! Learn what line graphs, bar graphs, pie charts, and pictographs are and how and when to use them to represent data. Each project shows how to build a chart or graph and ties it all together with a creative infographic that really puts the A in STEAM (Science, Technology, Engineering, ARTS, and Mathematics). Whether used as an introductory aid or to underscore previous knowledge, the book prepares today's visually savvy children to succeed in school and life by analyzing the world around them.
- ISBN
9781580898232 - Binding
Hardcover - Category
Science - Math

SHOW & TELL GREAT GRAPHS & SMART CHA
By: stuart murphy | Published: October 2022
A visual-learning expert races up the charts and graphs math success with kid-friendly content sure to help with homework. Want to find the most... [Read More]
A visual-learning expert races up the charts and graphs math success with kid-friendly content sure to help with homework. Want to find the most popular meal in the cafeteria? Compare town sports enrollments? Or maybe you just want to know who burps the most in your family! Learn what line graphs, bar graphs, pie charts, and pictographs are and how and when to use them to represent data. Each project shows how to build a chart or graph and ties it all together with a creative infographic that really puts the A in STEAM (Science, Technology, Engineering, ARTS, and Mathematics). Whether used as an introductory aid or to underscore previous knowledge, the book prepares today's visually savvy children to succeed in school and life by analyzing the world around them.
- ISBN
9781623541750 - Binding
Paperback - Category
Science - Math
